CoinCodeCap Weekly brings you an entire week’s market updates and news in one article. Got no time to stay updated during weekdays? No worries, we got your covered!
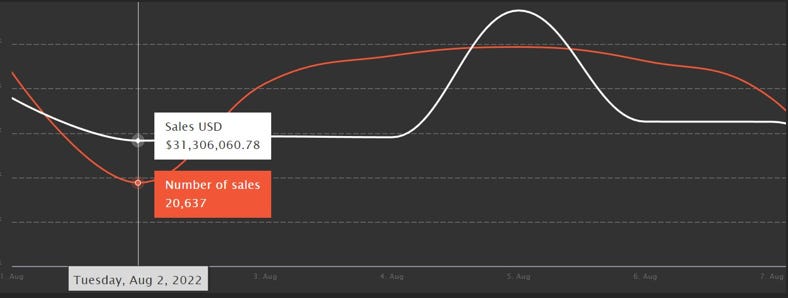
At the beginning of the week, we can see both the metrics facing a decrease in their data, reaching the lowest of the week on 2nd August. The lowest number of sales was 20.6K, while for the volume, it was 31.3M$. After 2nd August, we can see the number of sales increasing while the volume did not show a noticeable increase.
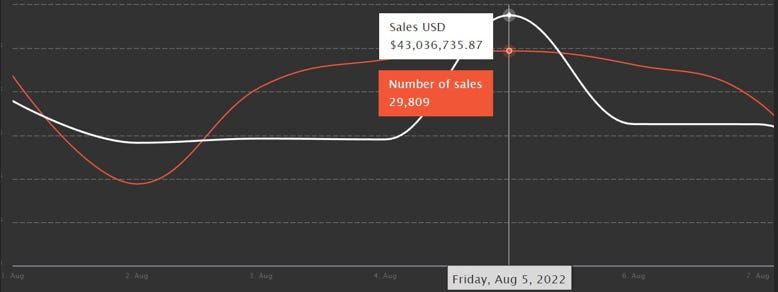
On 5th August, there was a huge increase in the volume. The volume was 43M$ which was the highest daily volume of the week. Simultaneously, on the same date, the number of sales also reached its highest daily volume of the week which was 29.8K. After that, the volume decreased and reached the same zone whereas the number of sales started showing a gradual decrease.
Active Market Wallets:
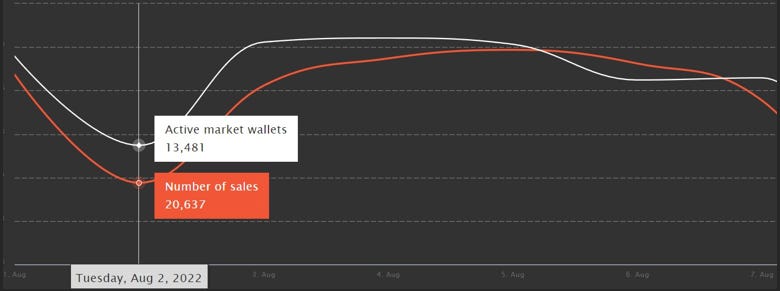
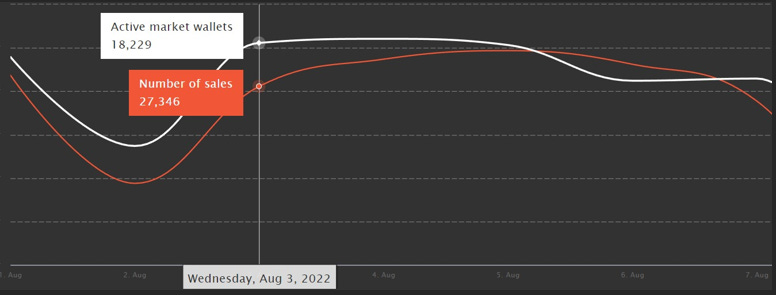
The data for active market wallets decrease at the beginning of the week, reaching its lowest, 13.4K. After that, it increased and remained around 18K for a few days. The highest data was recorded on Wednesday, 18.2K. Finally, near the end of the week, the data started decreasing.
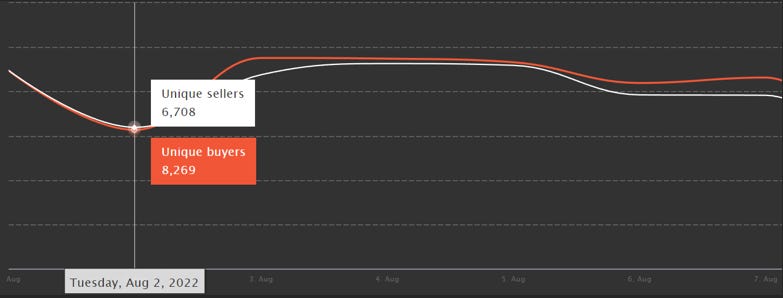
Unique Buyers and Unique Sellers:
As we previously discussed that active market wallets showed a decrease at the beginning of the week. So, the same happened with these two metrics, they decreased and reached their lowest on 2nd August. The lowest for the number of buyers was 8.2K, while for the number of sellers, the lowest was 6.7K.
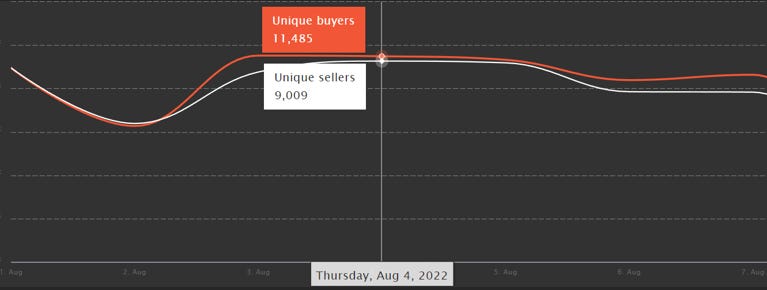
The number of buyers reached its highest data on 3rd August, it was 11.5K while the highest data for the number of sellers was recorded on 4th August, it was 9K.
Primary Sales and Volume:
These metrics also followed the pattern of other metrics at the beginning of the week. The lowest data for these metrics were recorded on 2nd August. For the number of primary sales, the lowest data was 6.6K, while for the volume of these sales, the lowest data was 654K$.
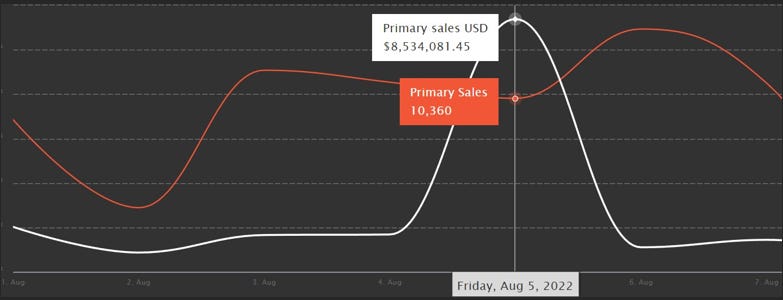
Moving forward, the number of primary sales shows a huge pump and then after decreasing a bit, there was another pump. Therefore, on 6th August, the highest daily data for the week was recorded which was 12.7K. As for the volume of the primary sales, there was a huge pump jumping 7x of the data on 5th August.
Therefore, on 5th August, the highest primary sales volume was recorded, which was 8.5M$. After the pump, the data for the primary sales volume returned to the previous zone.
Secondary Sales and Volume:
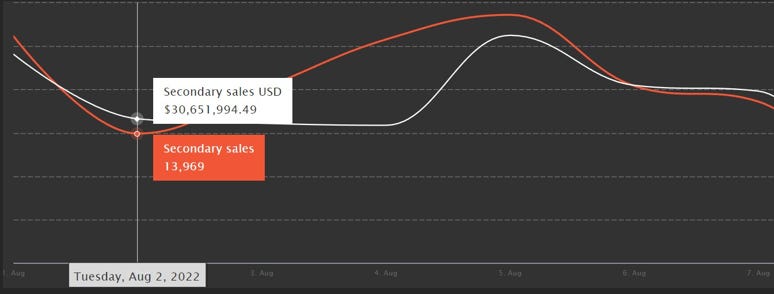
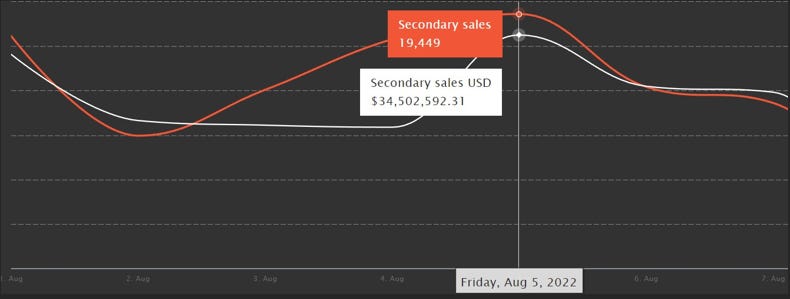
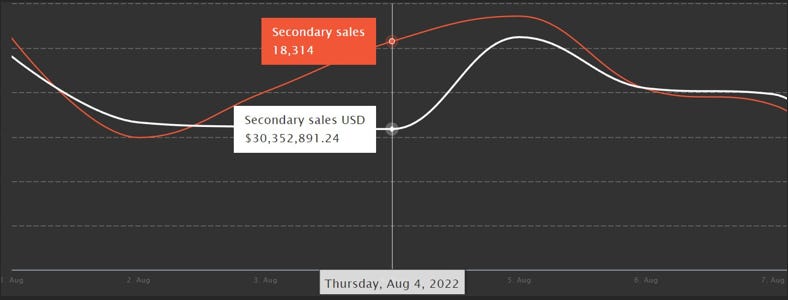
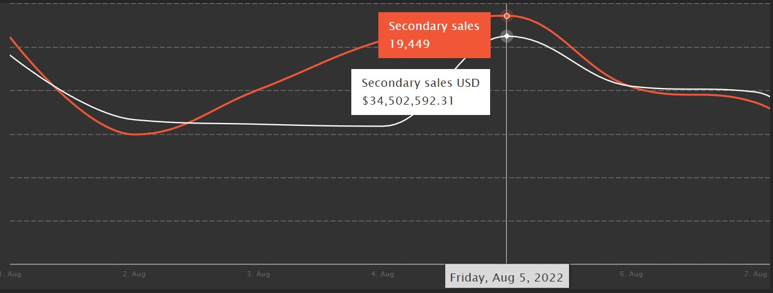
If we look at the number of secondary sales, it decreased at the beginning of the week and reached its lowest of the week, 13.9K, on 2nd August. After that, it increased gradually till 5th August and reached its highest data of the week, 19.4K. Near the end of the week, the data started showing a decrease.
Moving on to the secondary sales volume, it also decreased at the beginning reaching its lowest value of the week, 30.3M$, on 4th August. A pump can be seen the very next day taking the data to 34.5M$ which was also the highest daily secondary sales volume of the week. Reaching the end of the week, the data showed a decrease.
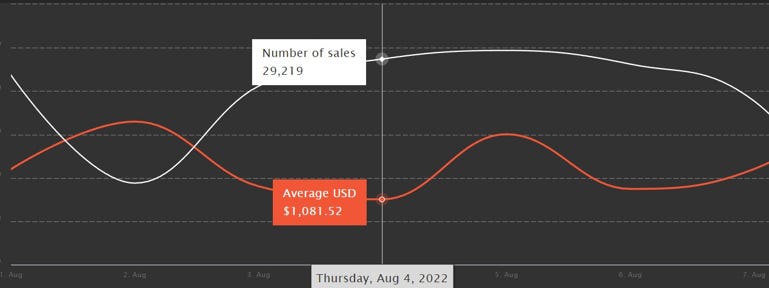
Average Price of an NFT:
The data for this metric showed multiple fluctuations. The highest data for this metric was recorded on 2nd August, and it was 1.5K$. The lowest data was recorded on 4th August and it was around 1K$.
Conclusion:
Overall, the NFT market has performed better this week compared to the previous week. Although, at the start of the week, the data looked weak but recovered as the days passed. We have seen quite a large pump in the primary sales volume serving as hope for new projects launching in the market. The pump in primary sales and its volume show that the NFT market is not dead and people will still dive into the market with their money if they see something that is worthy of it.
The secondary sales and volume also showed a pump in the data which shows that people also developed an interest in the secondary markets. The primary sales and secondary sales volume collectively led to an increase in the total volume of the market. This serves as a positive sign for the health of the market.
The number of buyers and sellers active in the market also increased this week, corresponding to developed interest in the market. Apart from this, the average price of an NFT, as we saw, showed multiple fluctuations but no major change was noticed.
The information above does not constitute investment advice, and the author does not ask you to either buy or sell any of the assets mentioned in the article.