CoinCodeCap Weekly brings you an entire week’s market updates and news in one article. Got no time to stay updated during weekdays? No worries, we got your covered!
The number of sales showed an overall increase. The highest data for this metric was recorded on 17th September, the data value was 35.3K. The lowest data was recorded on the 12th Sept which was 23.2K
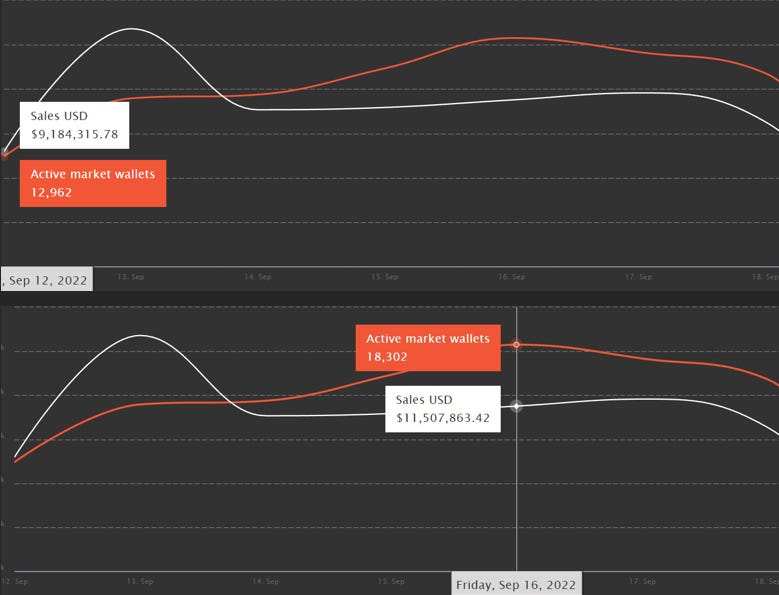
The volume of sales showed an overall increase. There was only one major pump throughout the week recording the highest data for the week. The highest daily data for this metric was 14M$ which was recorded on 13th Sept. On the other hand, the lowest data for this metric was recorded on 12th Sept which was almost 9.2M$.
Active Market Wallets:
This metric showed an overall increase. We saw the lowest of Active Market Wallets at the start of the week, which was 12K on 12th September. And the Highest of this Metric was recorded on 16th September which was 18K.
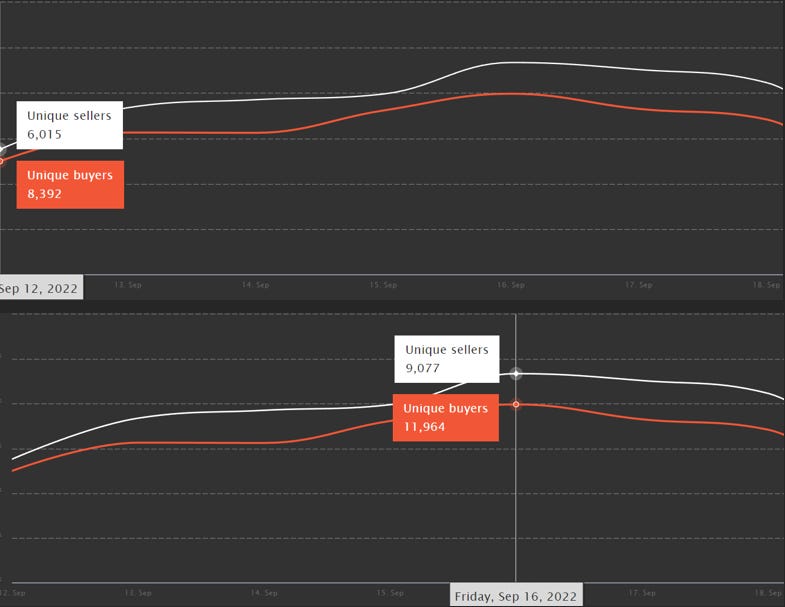
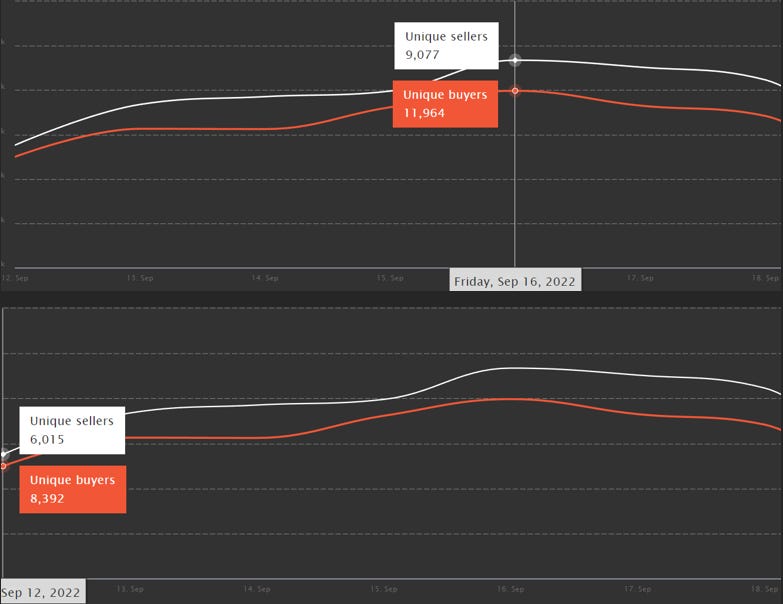
Unique Buyers and Unique Sellers:
We saw an overall increase in Unique Buyers. The Lowest of this Metric was recorded on 12th September (start of the week) which was 8.3K. And the highest of this Metric was recorded on 16th September which was 11.9K.
Unique Sellers also showed an overall increase. The Lowest of this Metric was recorded on 12th September (start of the week) which was 6K. And the Highest of this Metric was recorded on 16th September which was 9K.
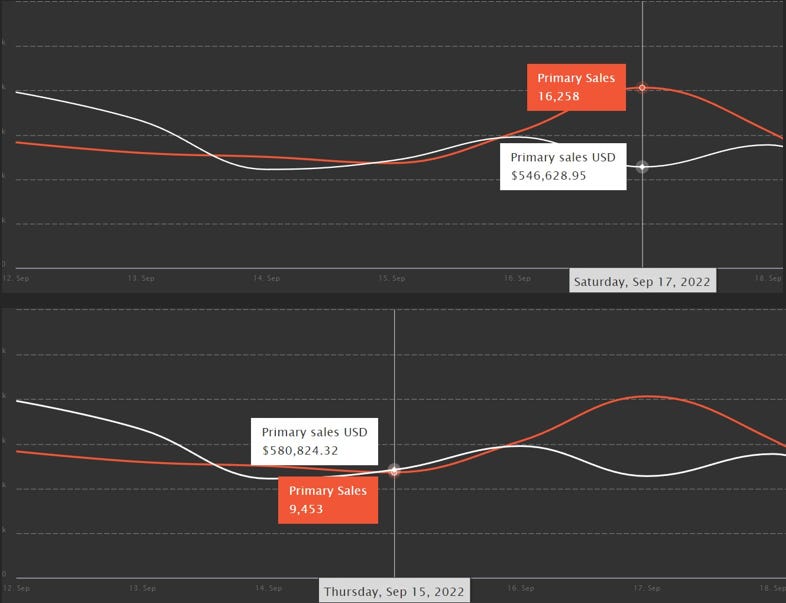
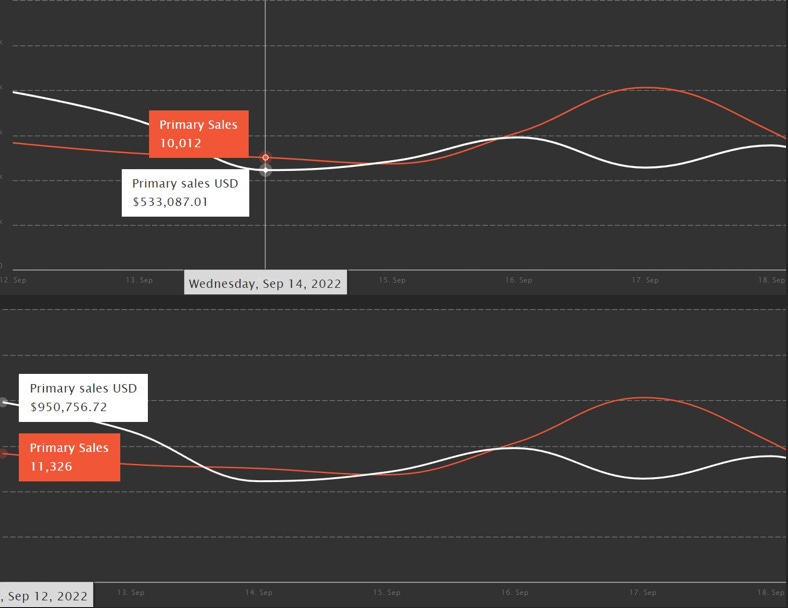
Primary Sales and Volume:
The number of primary sales showed an overall increase. The highest data was recorded on the 17th Sept which was 16.2K. The lowest data was recorded on the 15th Sept which was 9.4K.
The volume of primary sales showed an overall decrease. The highest data was recorded on the 12th Sept which was 950K. On the other hand, the lowest data was recorded on the 14th Sept which was 533K.
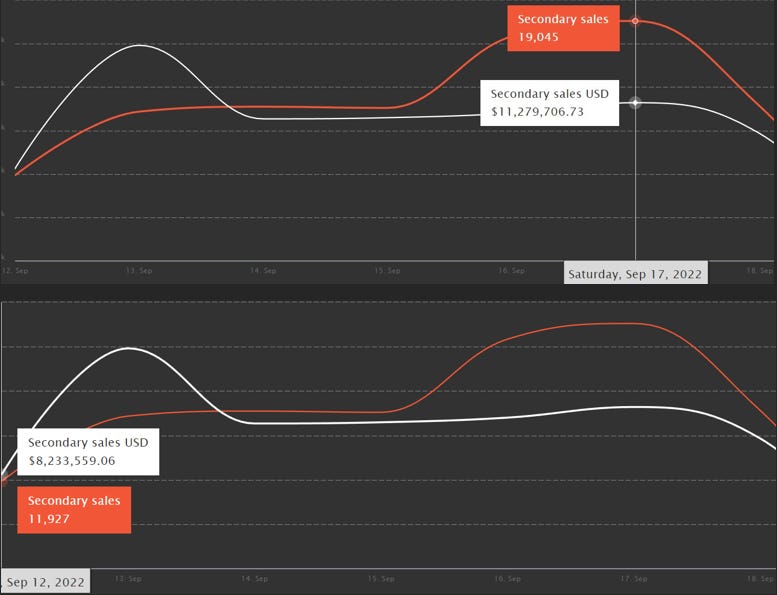
Secondary Sales and Volume:
The number of secondary sales showed an overall increase. The highest data was recorded on the 17th Sept which was 19K. On the other hand, the lowest data was recorded on the 12th Sept which was 11.9K.
The volume of secondary sales showed an overall decrease. The highest data was recorded on the 13th Sept which was 13.9M$. On the other hand, the lowest data was recorded on the 12th Sept which was 8.2M$.
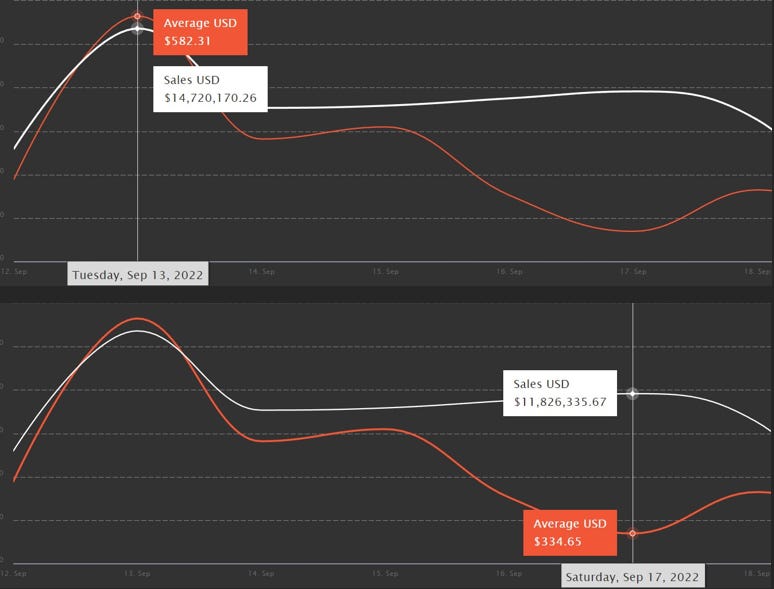
Average Price of an NFT:
This Metric showed an overall decrease. The highest average of an NFT was recorded on 13th September which was 582$. After it, we saw a dump and the Lowest of this Metric was recorded on 17th September which was 334$.
Conclusion:
Just like the past few weeks, almost all of the metrics have showed a decrease in data reflecting the continuation of the bearish phase. However, we have seen a pump in the number of primary sales and the overall sales, which reflects to an increase in the number of NFTs minted this week.
The information above does not constitute investment advice, and the author does not ask you to either buy or sell any of the assets mentioned in the article.