CoinCodeCap Weekly brings you an entire week’s market updates and news in one article. Got no time to stay updated during weekdays? No worries, we got your covered!
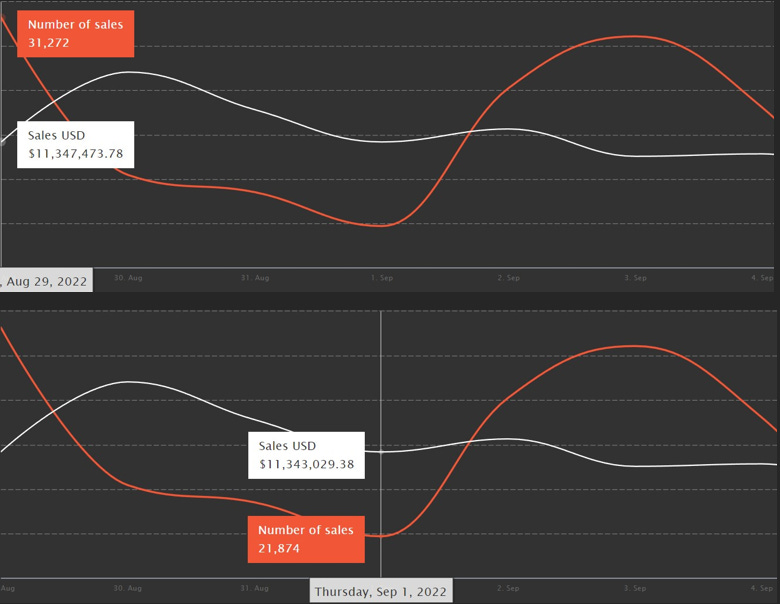
At the start of the week, we saw the highest of this metric on 29th August which was 31K. There was major fluctuation throughout the week, We saw the lowest number of sales on 1st September which was 21K. This metric showed an overall decrease.
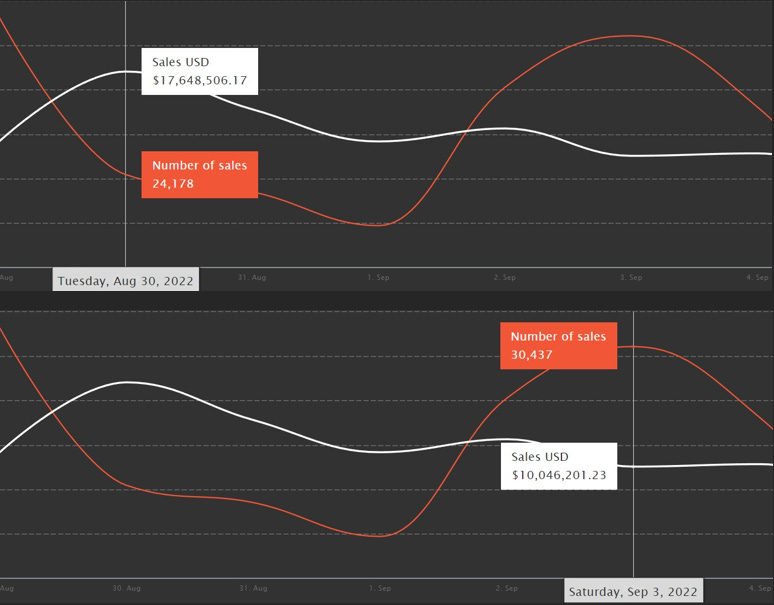
The highest volume of sales was recorded on 30th August which was 17.6M$. There were no major Fluctuations. The Lowest volume of sales was recorded on 3rd September which was 10M$. This metric showed an overall decrease.
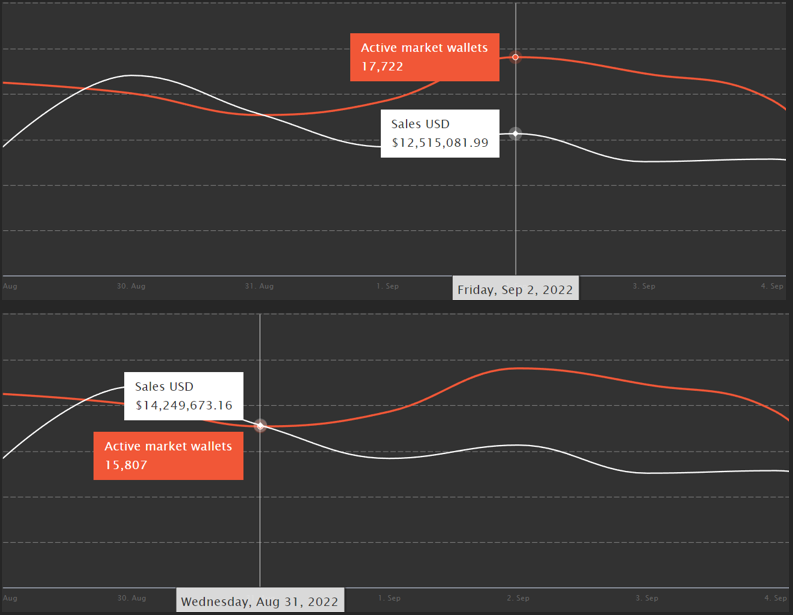
Active Market Wallets:
The lowest of this metric was recorded on 31st August which was 15K. And the highest of this metric was recorded on 2nd September which was 17.7K. This metric showed an overall decrease.
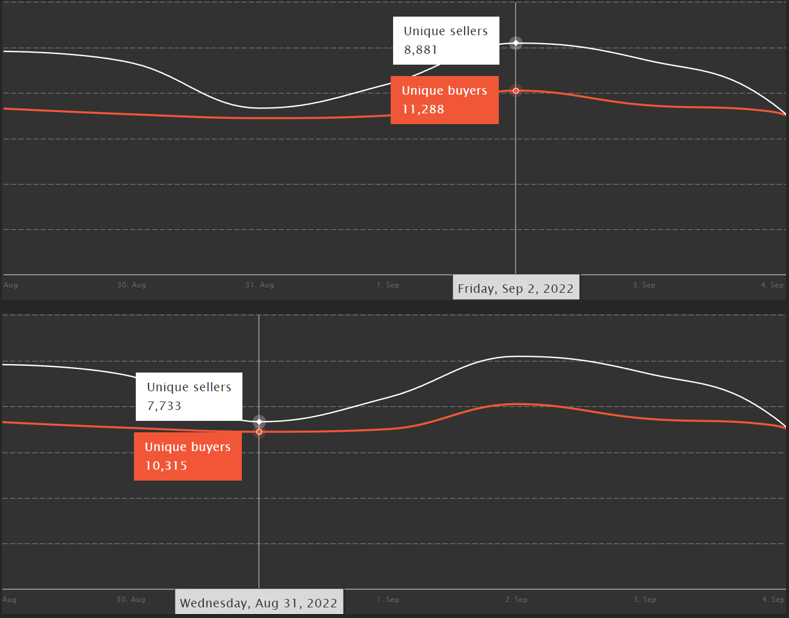
Unique Buyers and Unique Sellers:
We saw the lowest number of unique buyers on 31st August which was 10.3K. And the highest of this metric was recorded on 2nd September which was 11.2K. The number of unique buyers showed an overall decrease.
We saw the lowest number of unique sellers on 31st which was 7.7K. And the highest of this metric was recorded on 2nd September which was 8.8K. The number of unique sellers showed an overall decrease too.
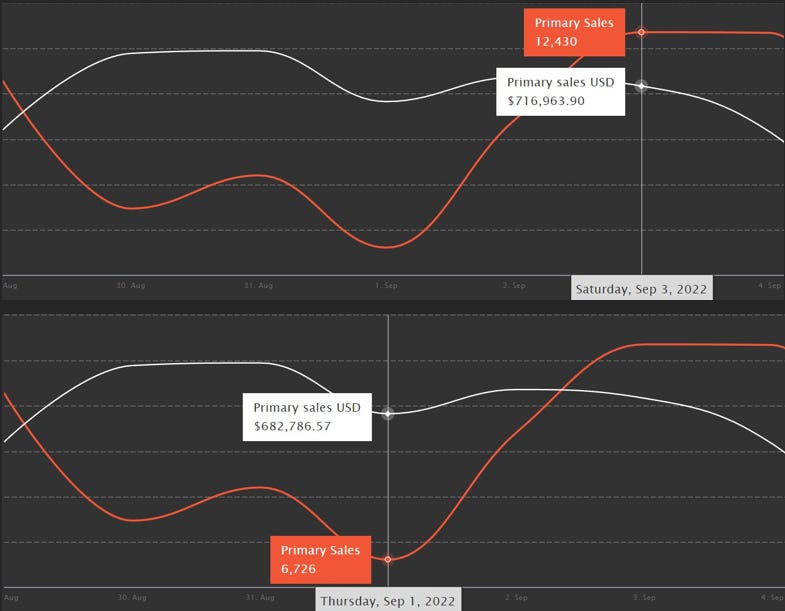
Primary Sales and Volume:
We saw the lowest number of primary sales on 1st which was 6.7K. And the highest number of primary sales were recorded on September 3 which was 12.4K. This metric showed an overall increase.
The volume of Primary Sales decreased throughout the week. However, the data showed fluctuations throughout the week. The highest daily data was recorded on 15th August which was 1.2M$. On the other hand, the lowest daily data was recorded on 21st August which was 828K.
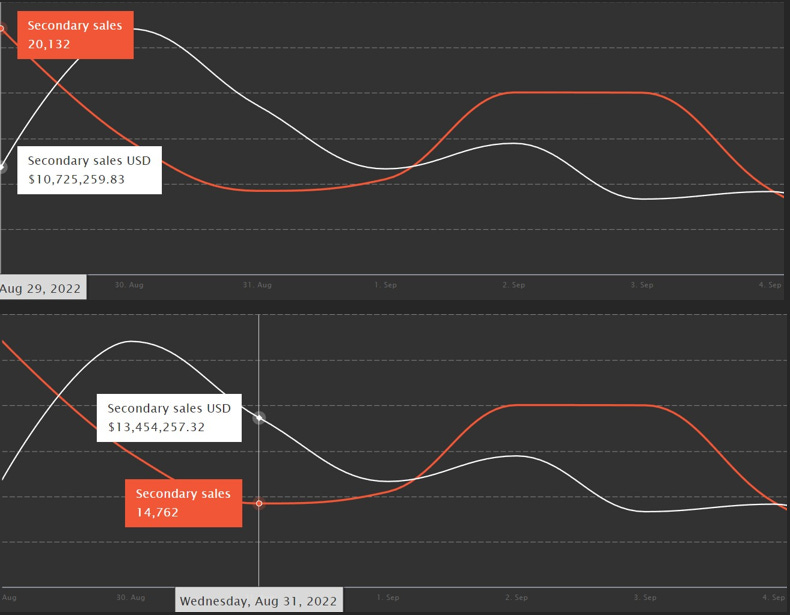
Secondary Sales and Volume:
We saw an overall decrease in the number of Secondary Sales. At the start of the week, we saw the highest Secondary Sales which was 20K. And the Lowest of this metric was recorded on 31st August which was 14.7K.
The volume of Secondary Sales showed an overall decrease too. We saw a pump on 30th August and it was the highest of this metric which was 16M$. The lowest of this metric was recorded on 3rd September which was 9M$.
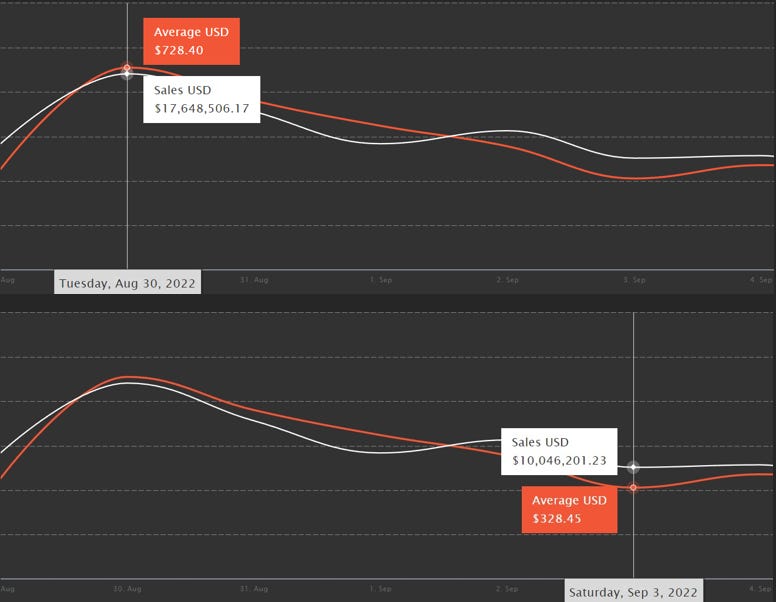
Average Price of an NFT:
The highest of this metric was recorded on 30th August which was 728$. And the lowest of this metric was recorded on 3rd September which was 328$. This metric showed an overall increase.
Conclusion:
Just like the past few weeks, all the metrics have been showing noticeable decrease in their value. This is a negative sign for the market as it shows the continuation of the bear market.
The information above does not constitute investment advice, and the author does not ask you to either buy or sell any of the assets mentioned in the article.