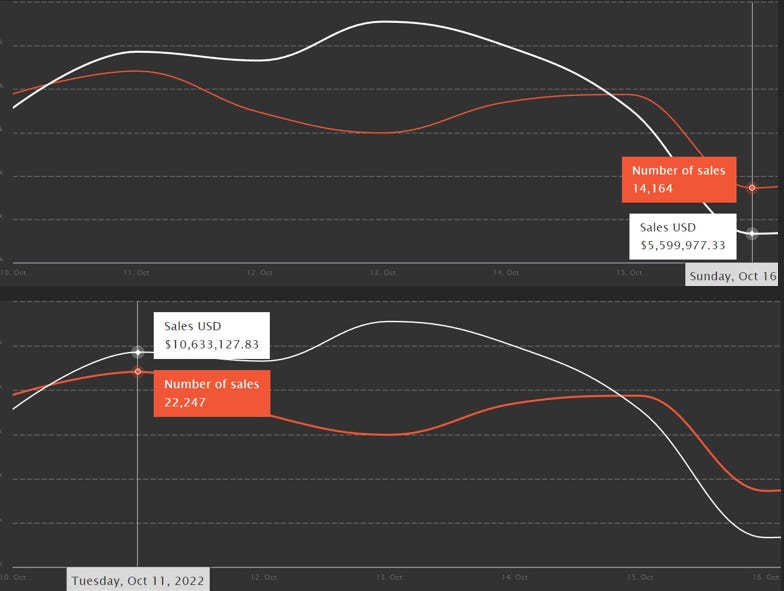
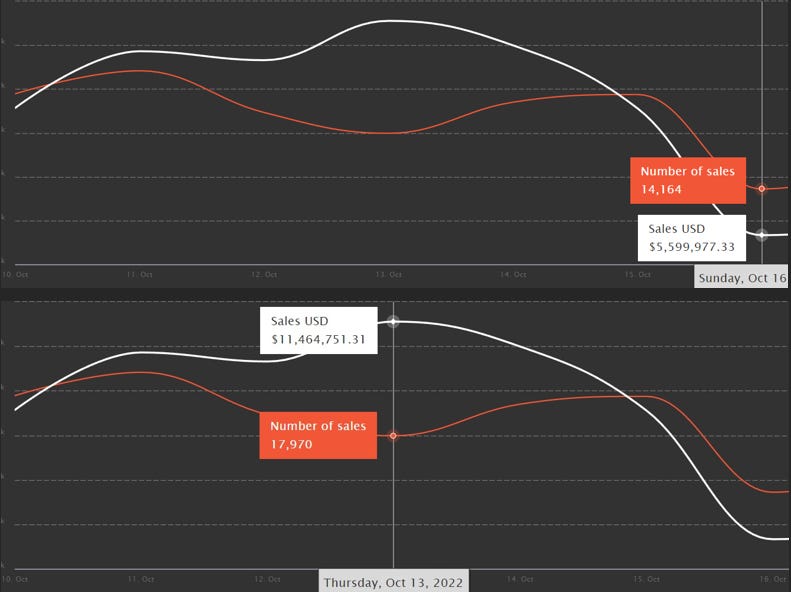
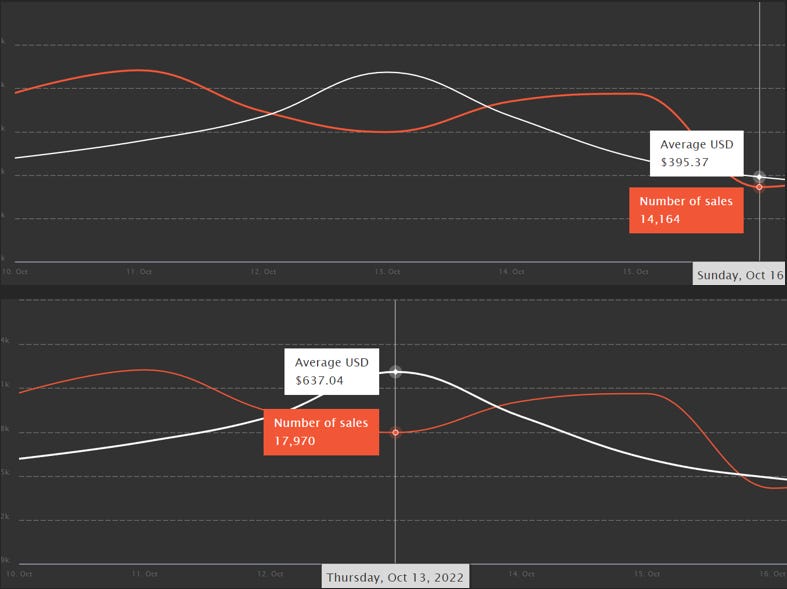
Number of Sales showed an overall decrease throughout the week. The Highest of this Metric was recorded on 11th October which was 22.2K. And the Lowest of this Metric was recorded at the end of the week on 16th October which was 14.1K.
Sales Volume Also showed an overall decrease. The Highest of this Metric was recorded on 13th October which was 11.4M$. And the Lowest of this Metric was recorded on 16th October which was almost 5.6M$.
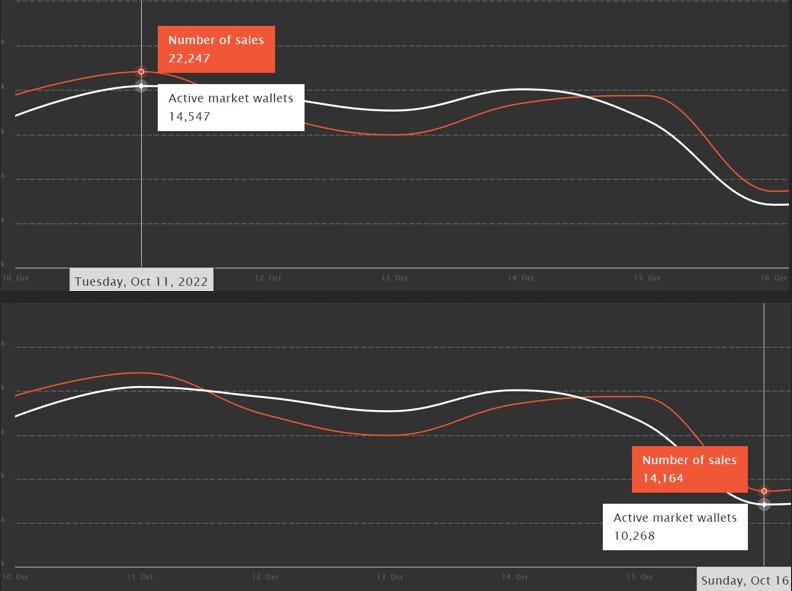
Active Market Wallets:
Active Market Wallets showed an overall decrease. The Highest of this Metric was recorded on 11th October which was 14.5K. And the Lowest of this Metric was recorded on 16th October which was 10.2K.
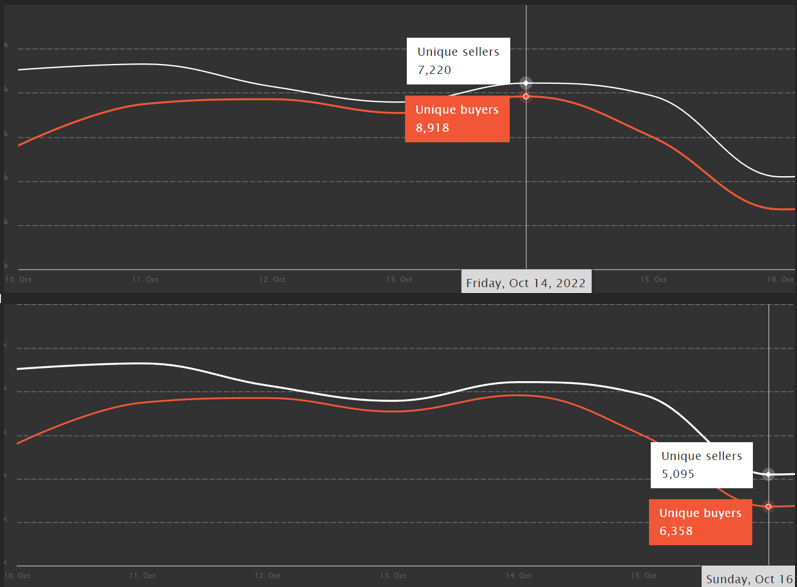
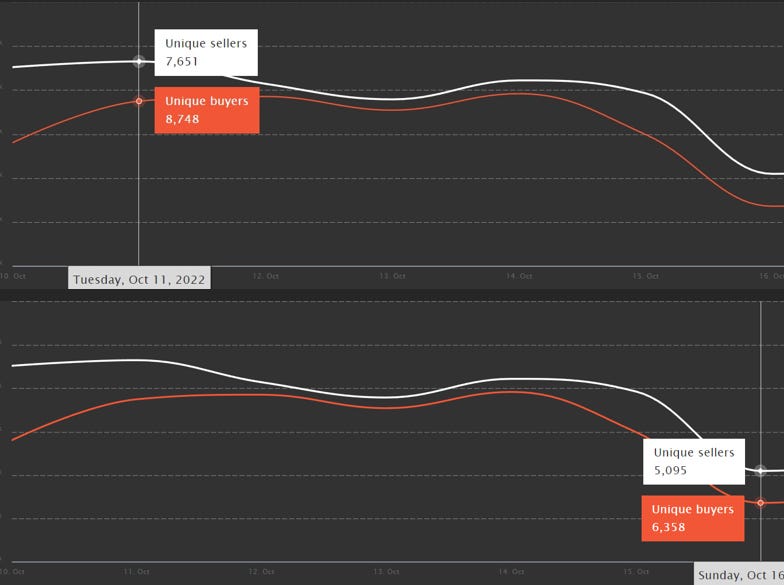
Unique Buyers and Unique Sellers:
Unique Buyers showed an overall decrease. The Highest of this Metric was recorded on 14th October which was 8.9K and the Lowest of this Metric was recorded on 16th October which was 6.3K. There were no major changes in the trend of the data.
Unique Sellers also showed an overall decrease. The Highest of this Metric was recorded on 11th October which was 7.6K. And the Lowest of this Metric was recorded on 16th October which was 5K.
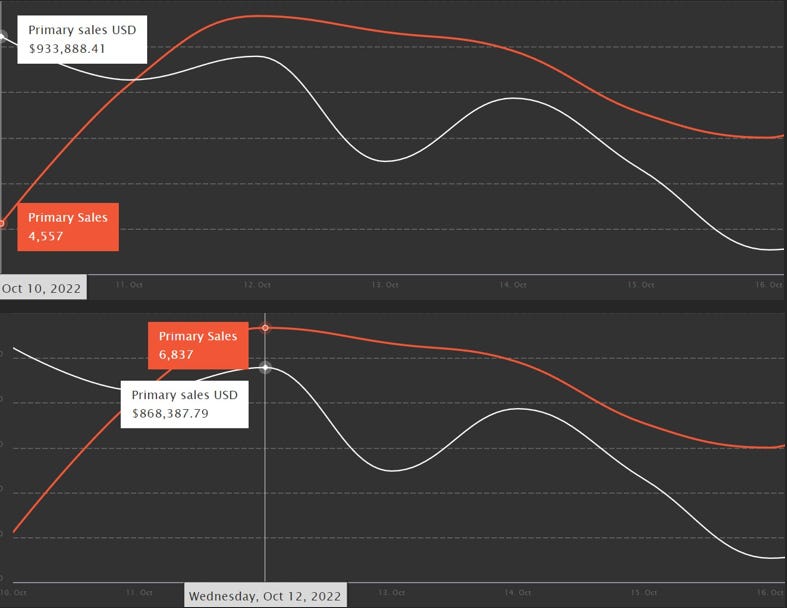
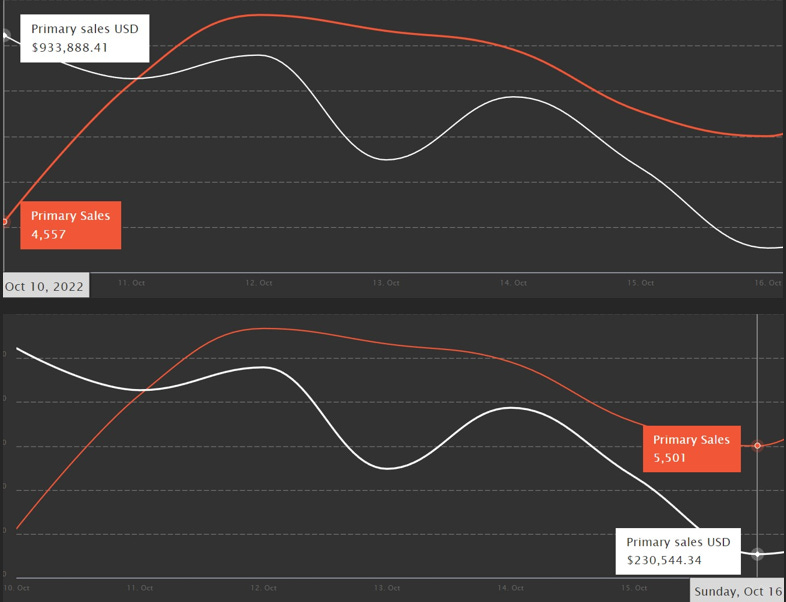
Primary Sales and Volume:
The number of Primary Sales showed an overall increase throughout the week. The Highest of this Metric was recorded on 12th October which was 6.8K. The Lowest of this Metric was recorded at the start of the week which was 4.5K.
Primary Sales volume showed an overall decrease. The Lowest of this Metric was recorded on 16th October which was 230.5K$, And the Highest of this Metric was recorded on 10th October which was 933.8K$.
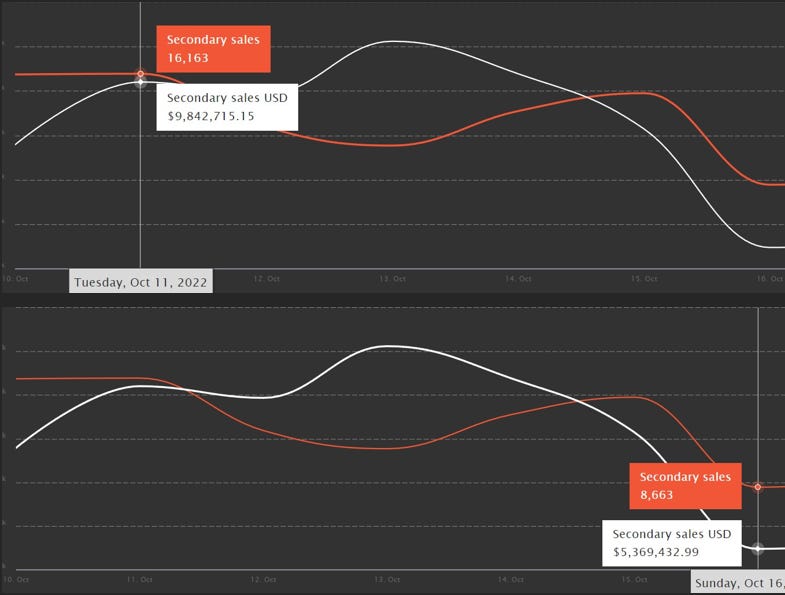
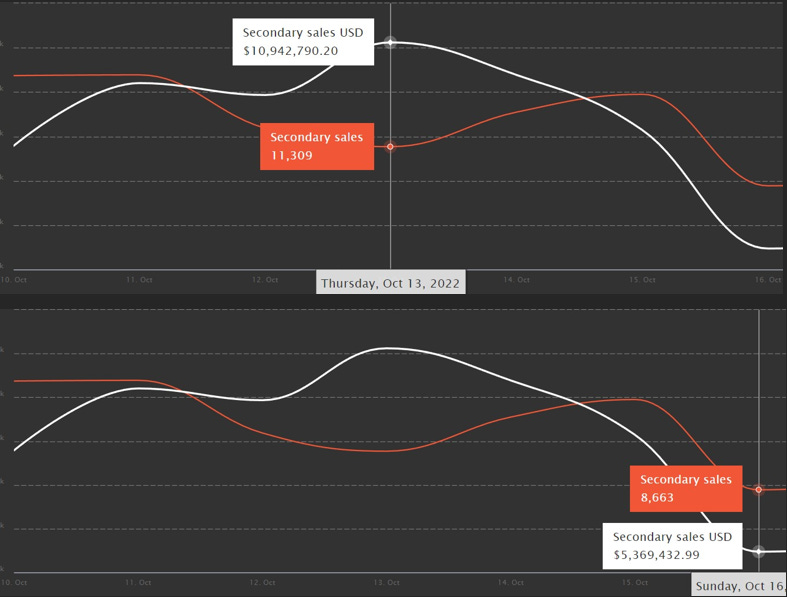
Secondary Sales and Volume:
The number of secondary sales showed an overall decrease throughout the week. The highest number of secondary sales was 16.1K which was recorded on October 11th. Meanwhile, the lowest number of secondary sales was 8.6K which was recorded on October 16th.
The secondary sales volume showed an overall decrease throughout the week. The highest secondary sales volume was 10.9M$ which was recorded on October 13th. Meanwhile, the lowest secondary sales volume was 5.3M$ which was recorded on October 16th.
Average Price of an NFT:
We saw an overall decrease in this Metric throughout the week. The Highest of this Metric was recorded on 13th October which was 637$. And The Lowest of this Metric was recorded on 16th October which was 395$.
Conclusion:
In every metric, except for the average price of an NFT, we saw a decrease in the weekly data.
The information above does not constitute investment advice, and the author does not ask you to either buy or sell any of the assets mentioned in the article.