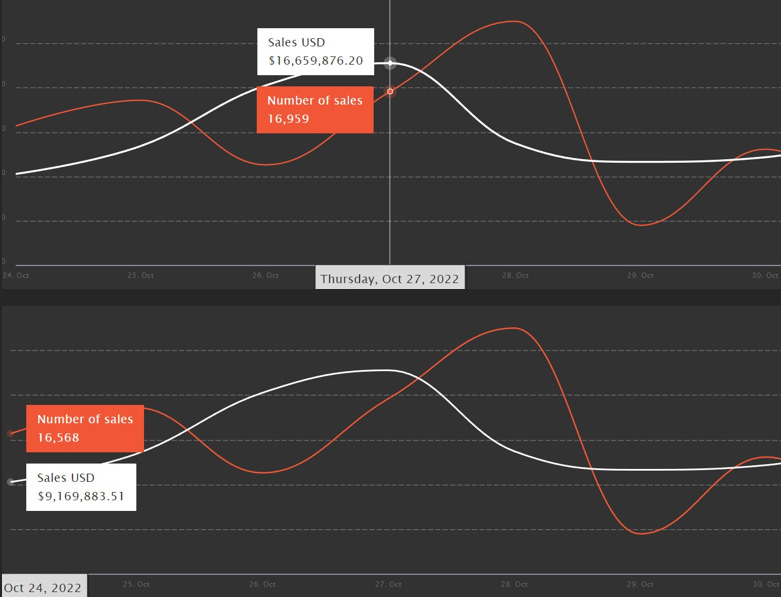
So, we saw a lot of fluctuations in number of sales this week. We saw the highest of this metric on 28th October which was 17.7K. And we saw the Lowest on 29th October which was 15.4K. This metric showed an overall decrease.
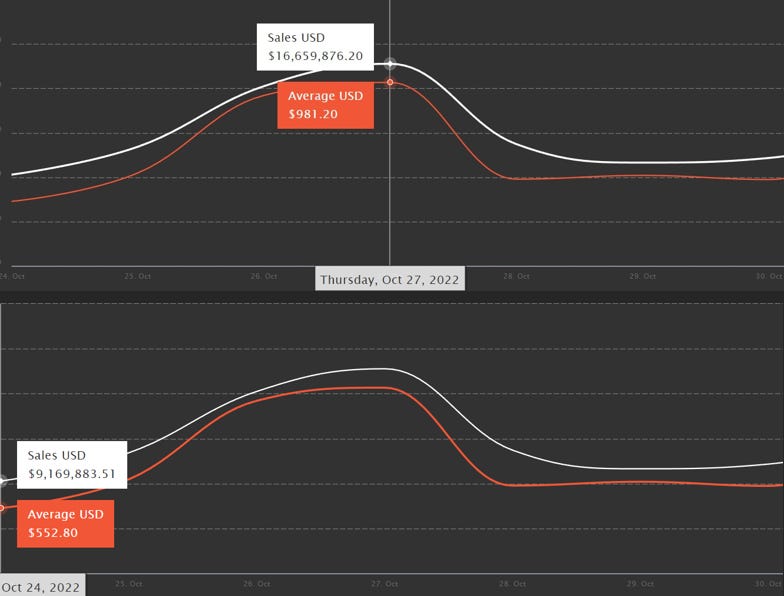
Volume also showed Fluctuations. The Lowest of this Metric was recorded on 24th October which was 9.1M$. And the highest of this metric was recorded on 27th October which was 16.6M$. We saw an overall increase.
Active Market Wallets:
We saw fluctuations in this Metric. We saw the Highest of this Metric on 25th October which was 13.2K. And the Lowest of this metric was recorded on 29th October which was 11.3K. Active Market Wallets showed an overall decrease.
Unique Buyers and Unique Sellers:
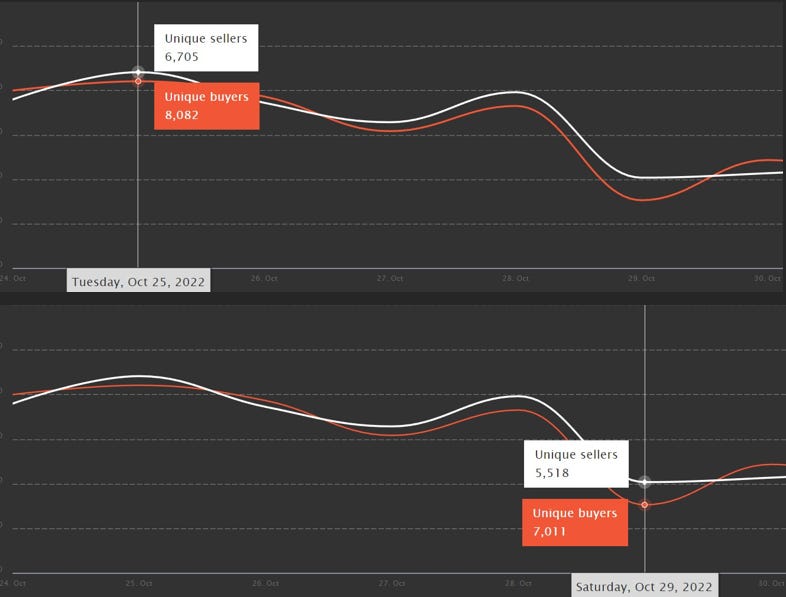
We saw the highest of Unique Buyers on 25th October which was 8k. And the Lowest of Unique Buyers was recorded on 29th October which was 7k. This Metric showed an overall Increase.
We saw the highest of Unique Sellers on 25th October which was 6.7K. And the Lowest of Unique Sellers was recorded on 29th October which was 5.5K. This Metric also showed an overall Decrease.
Primary Sales and Volume:
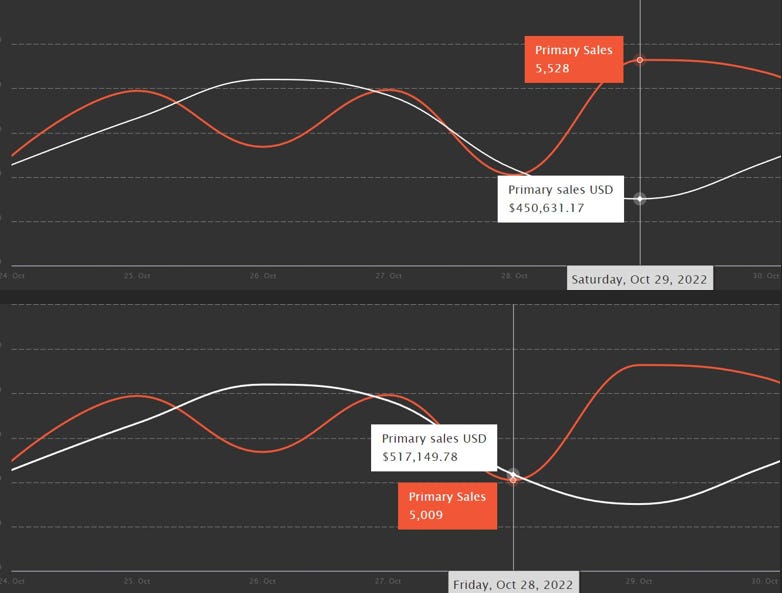
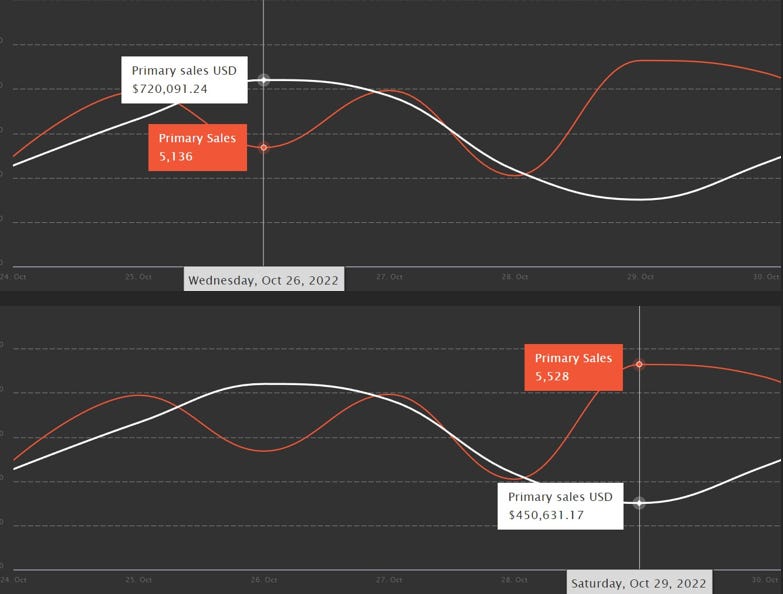
Primary Sales showed an overall Increase. The Lowest of this Metric was recorded on 28th October which was 5k. And the Highest was recorded on 29th October which was 5.5K.
The Primary Sales Volume showed an overall Increase. The highest of this Metric was recorded on 26th October which was 720K$. And the Lowest of this Metric was recorded on 29th October which was 450K$.
Secondary Sales and Volume:
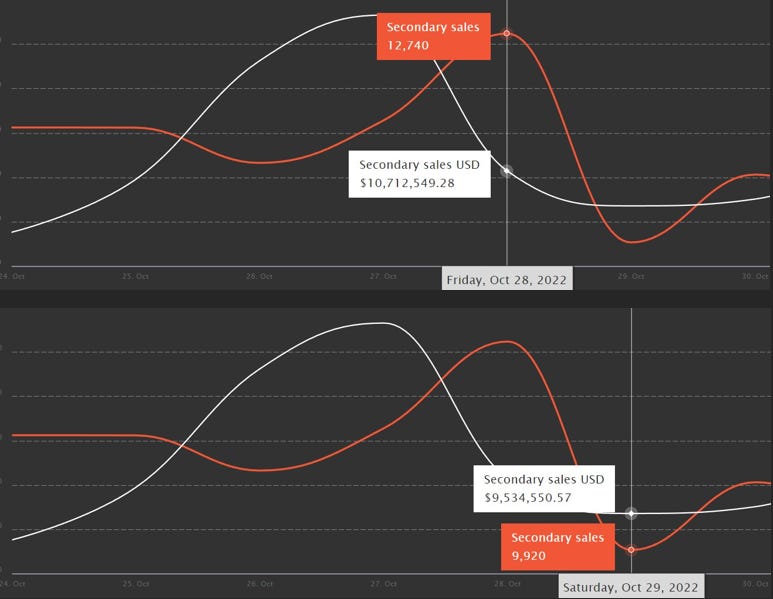
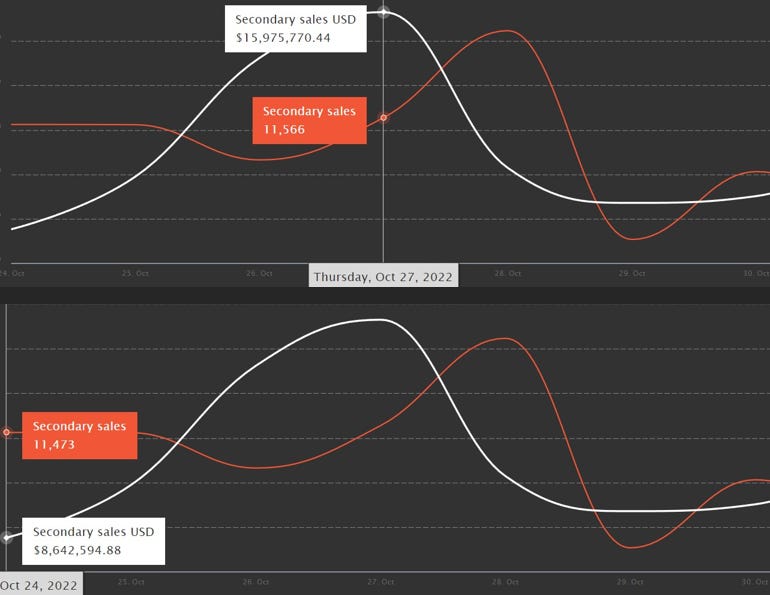
Secondary Sales showed an overall Decrease. The Highest of this Metric was recorded on 28th October which was 12.7K. And the Lowest of this Metric was recorded on 29th October which was 9.9K.
Secondary Sales Volume showed an overall Increase. The Lowest of this Metric was recorded at the start of the week which was 8.6M$. And the Highest of this Metric was recorded on 27th October which was 15.9M$.
Average Price of an NFT:
This Metric showed an overall Increase. The Highest Average Price of an NFT was recorded on 27th October which was 981$. And the Lowest of this Metric was recorded at the start of the week which was 552$.
Conclusion:
The total number of sales showed a decrease whereas the total volume of the market showed an increase. The average price of an NFT also showed an increase. Other than that, most of the metrics showed a decrease.
The information above does not constitute investment advice, and the author does not ask you to either buy or sell any of the assets mentioned in the article.