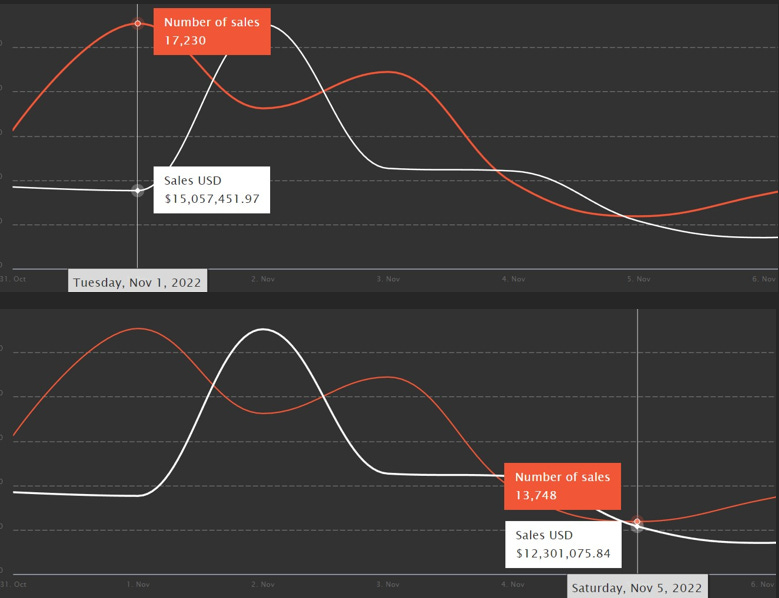
The Highest Number of Sales was recorded on 1st November which was 17.2K. And the Lowest of Number of Sales was recorded on 5th November which was 13.7K. This Metric showed an overall Decrease.
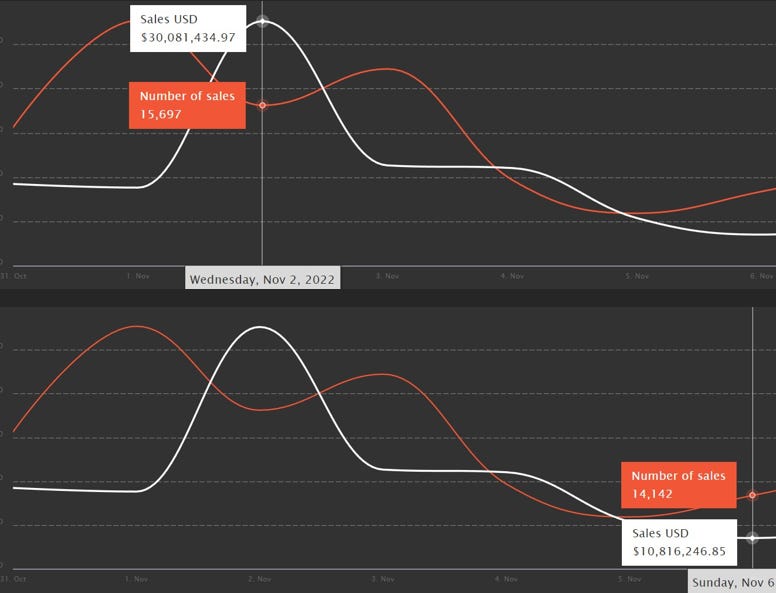
So, the Highest Volume was recorded on 2nd November which was 30M$. And the Lowest was recorded at the end of the week on 6th November which was 10.8M$. This Metric showed an overall Decrease.
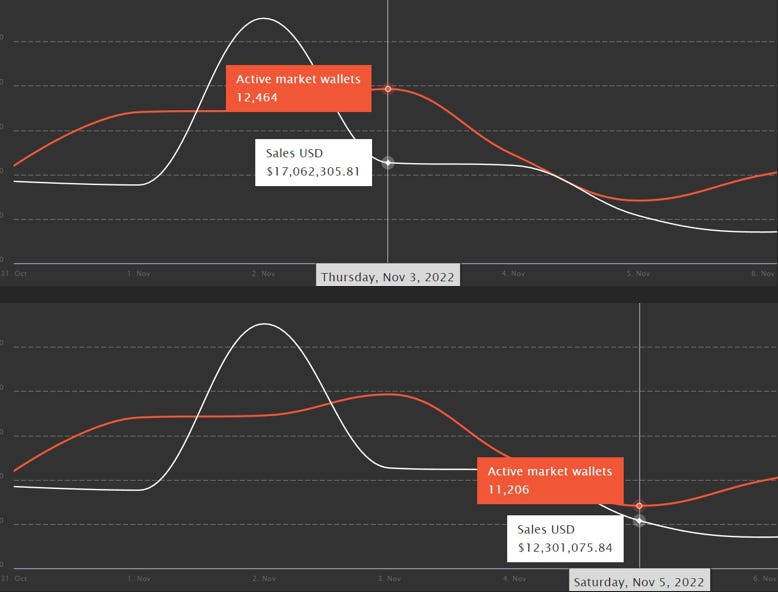
Active Market Wallets:
The Highest Active Market Wallets was recorded on 3rd November which was 12.4K. And the Lowest was recorded on 5th November which was 11.2K. This Metric showed an overall Decrease.
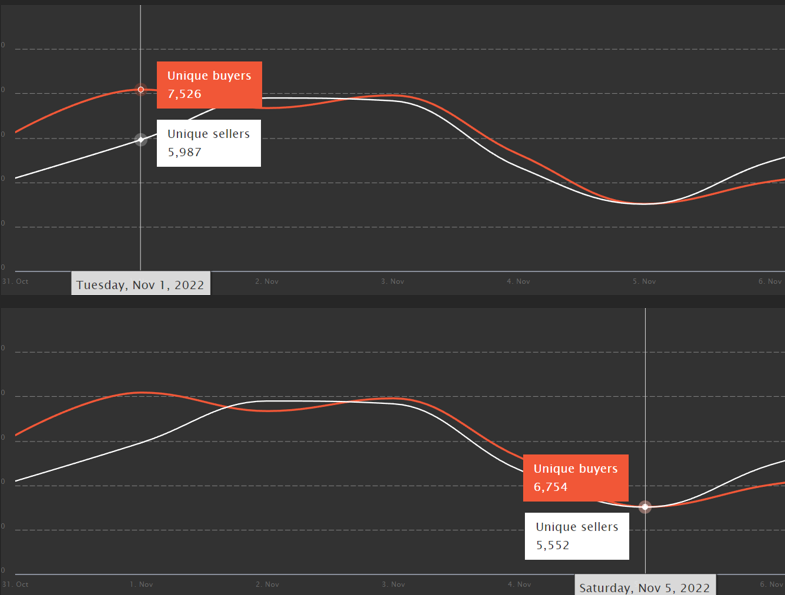
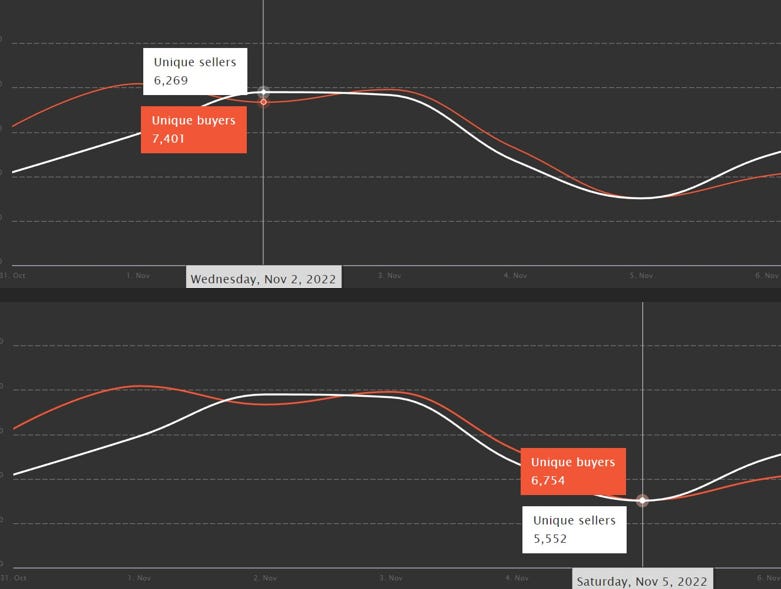
Unique Buyers and Unique Sellers:
The Highest number of Unique Buyers was recorded on 1st November which was 7.5K. And the Lowest was recorded on 5th November which was 6.7K. This Metric showed an overall Decrease.
The Highest number of Unique Sellers wad recorded on 2nd November which was 6.2K. And the Lowest number of Unique Sellers was recorded on 5th November which was 5.5K. This Metric showed an overall Increase.
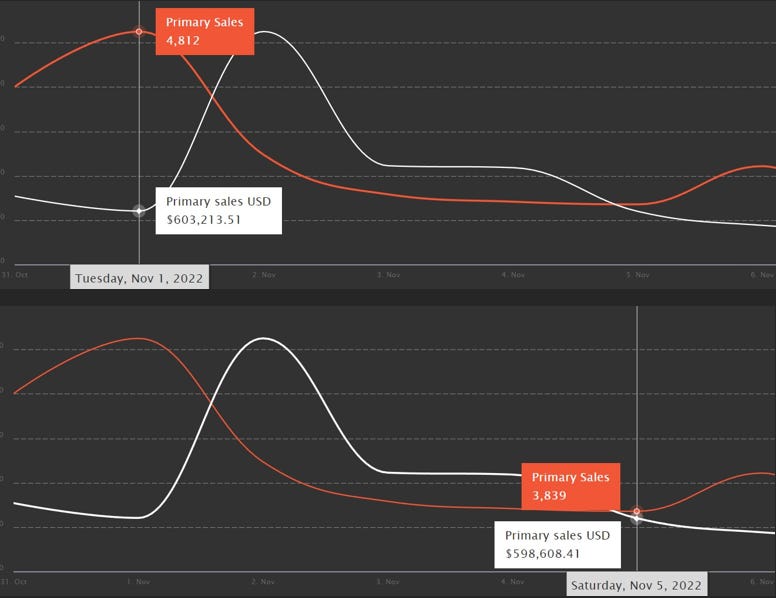
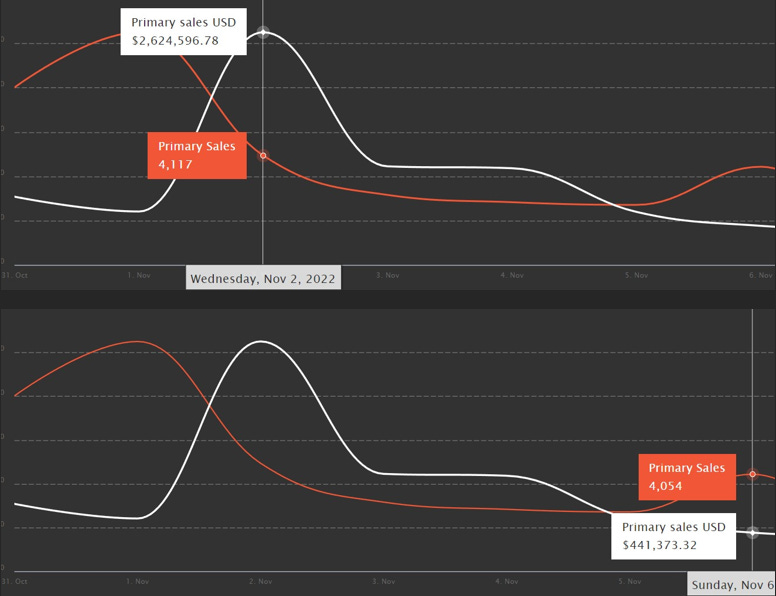
Primary Sales and Volume:
Primary Sales showed an overall decrease. The Lowest of this Metric was recorded on 5th November which was 3.8K. And the Highest was recorded on 1st November which was 4.8K.
The Primary Sales Volume showed an overall decrease. The highest of this Metric was recorded on 2nd November which was 2.6M$. And the Lowest of this Metric was recorded on 6th November which was 440K$.
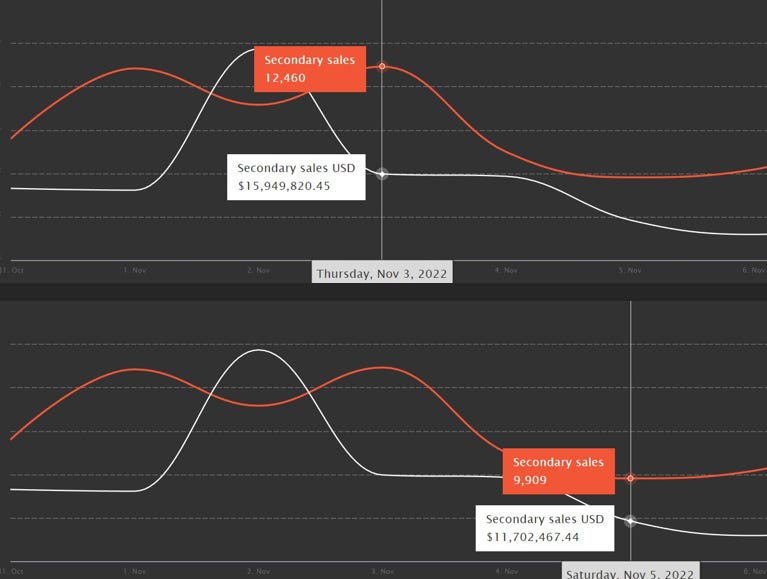
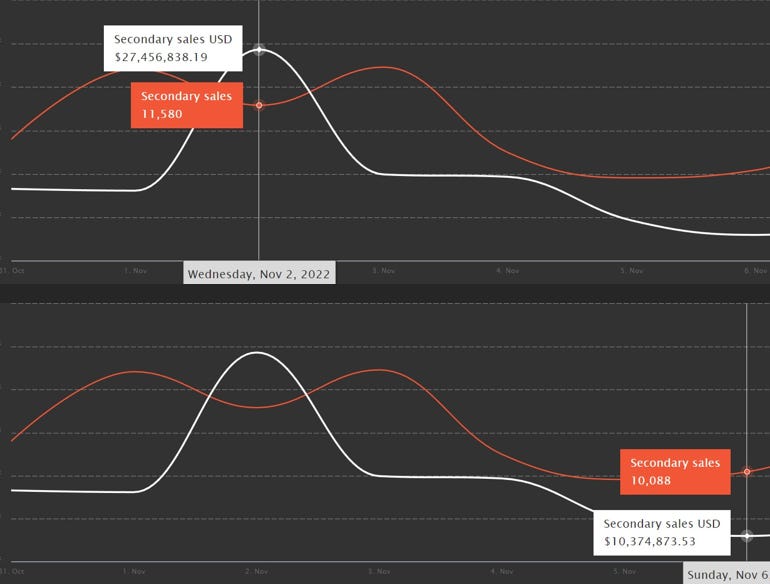
Secondary Sales and Volume:
Secondary Sales showed an overall decrease. The Highest of this Metric was recorded on 3rd November which was 12.4K. And the Lowest of this Metric was recorded on 5th November which was 9.9K.
Secondary Sales Volume showed an overall decrease. The Lowest of this Metric was recorded on 6th November which was 10.3M$. And the Highest of this Metric was recorded on 2nd November which was 27.4M$.
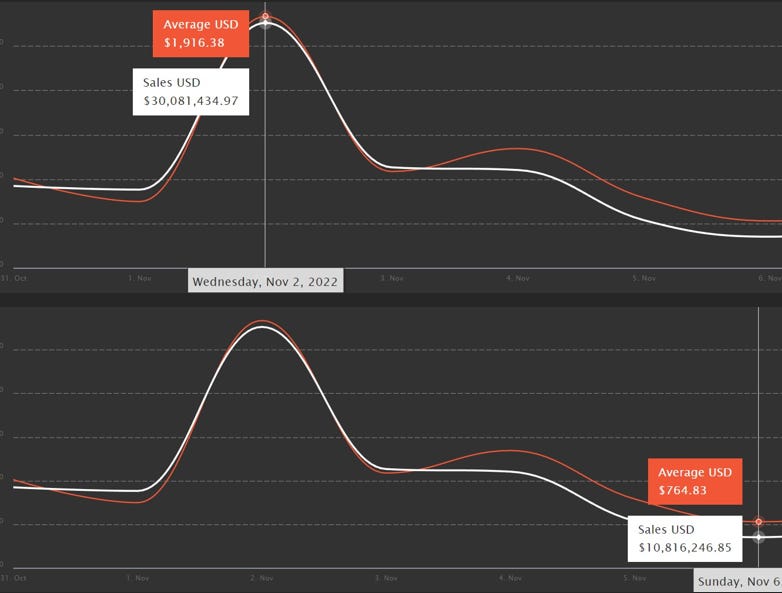
Average Price of an NFT:
This Metric showed Fluctuations throughout the week. The Highest Average price of an NFT was recorded on 2nd November which was 1.9K$. And the Lowest was recorded at the end of the week which was 764$. This Metric showed an overall Decrease.
Conclusion:
Most of the metrics showed a decrease in the weekly timeframe. However, we saw a major increase in the total volume and the average price of an NFT. Other than that, there were no major increments on the weekly timeframe.
The information above does not constitute investment advice, and the author does not ask you to either buy or sell any of the assets mentioned in the article.