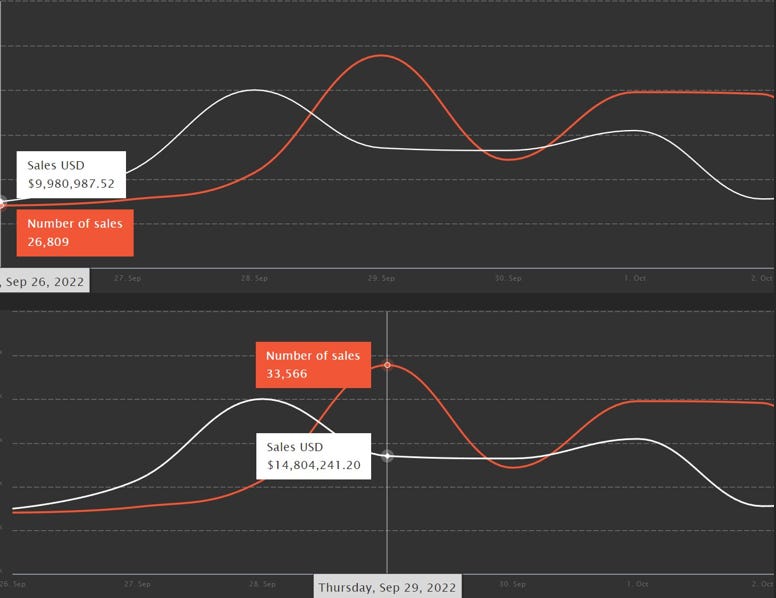
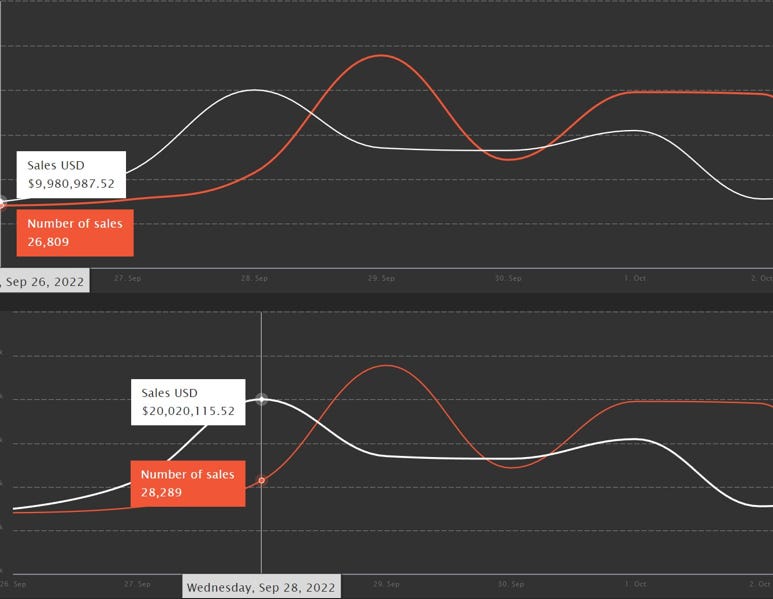
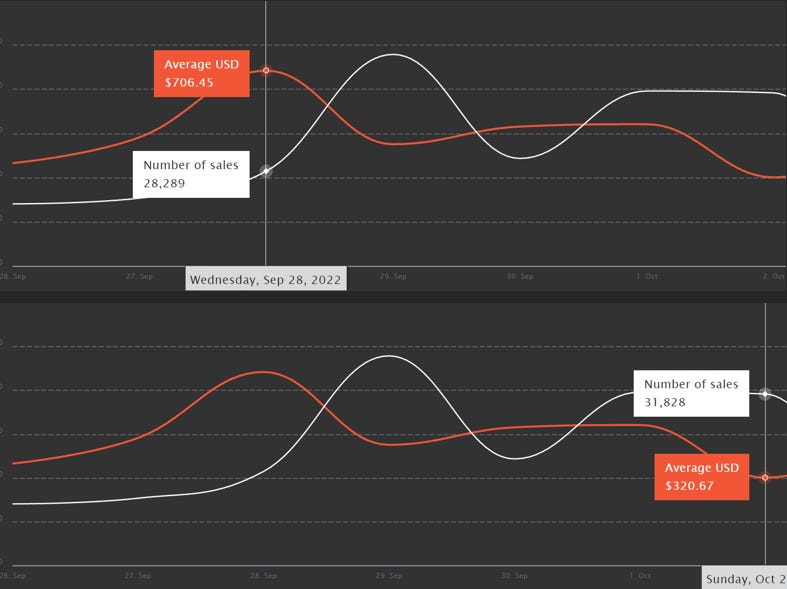
Number Of Sales showed an overall Increase. The Lowest of this metric was recorded at the start of the week which was 26.8K. The Highest of this Metric was recorded on 29th September which was 33.5K.
We saw the lowest of volume at the start of the week which was 9.9M$. And the Highest of this metric was recorded on 28th September which was 20M$. This Metric Showed an overall Increase.
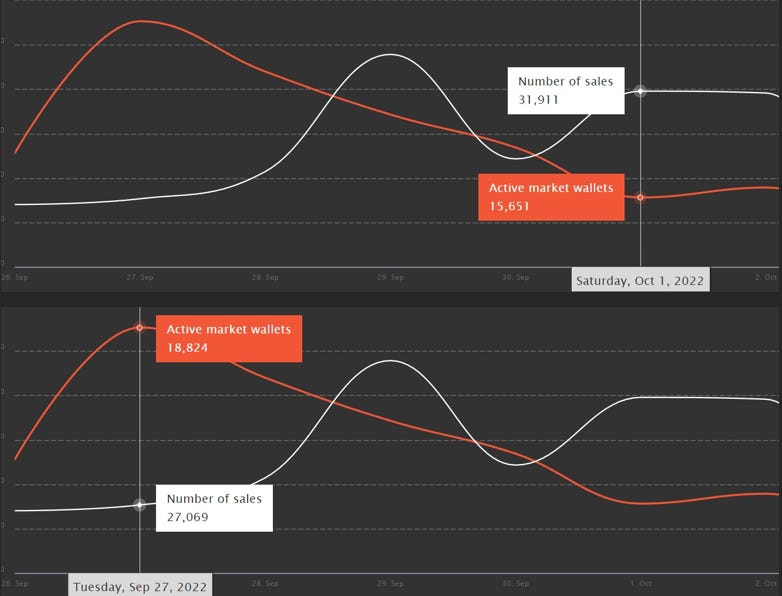
Active Market Wallets:
This Metric showed an Overall Decrease. The Highest of this Metric was recorded on 27th September which was 18.8K. After it we saw a downwards moment and the Lowest of this Metric was recorded on 1st October which was 15.6K.
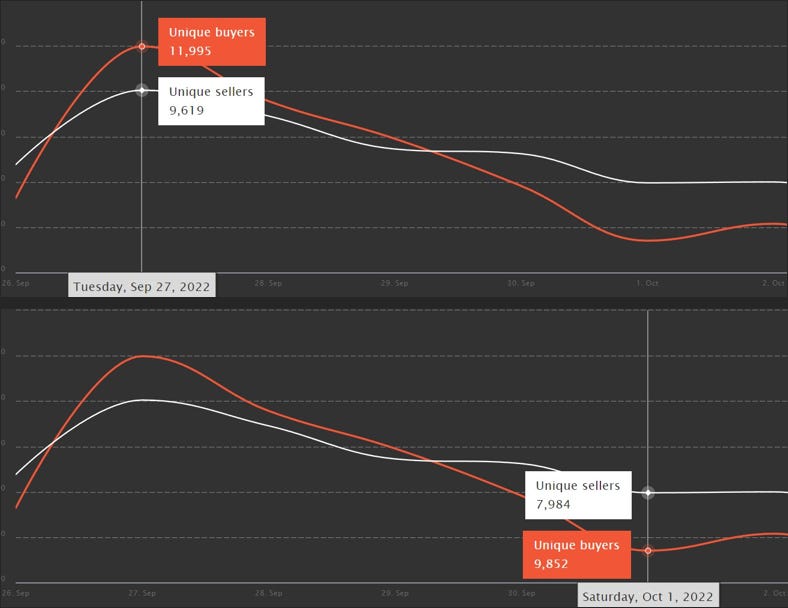
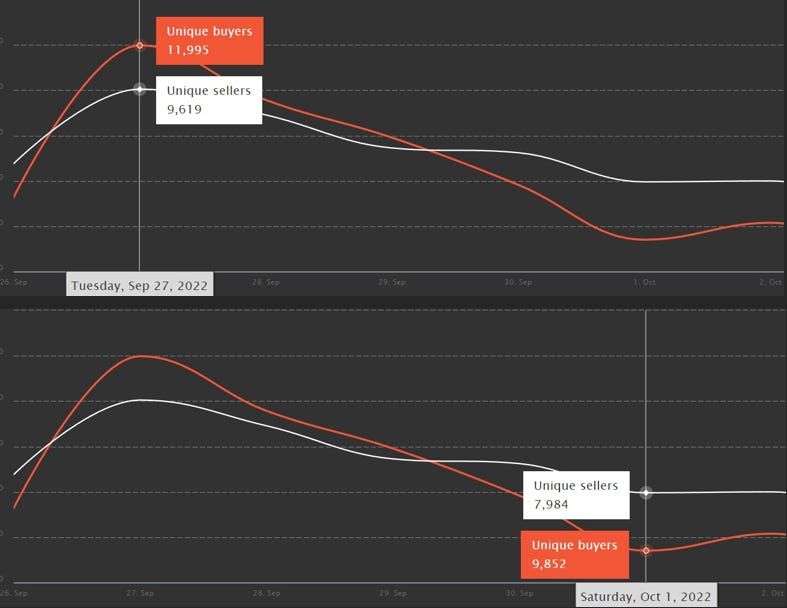
Unique Buyers and Unique Sellers:
The number of unique buyers showed an overall decrease throughout the week. The highest of this metric was recorded on 27th September which was almost 12K. And the Lowest of this Metric was recorded on October 1st which was 9.85K.
The number of unique sellers showed an overall decrease throughout the week. The highest of this metric was recorded on 27th September which was 9.6K. And the Lowest of this Metric was recorded on October 1st which was almost 8K.
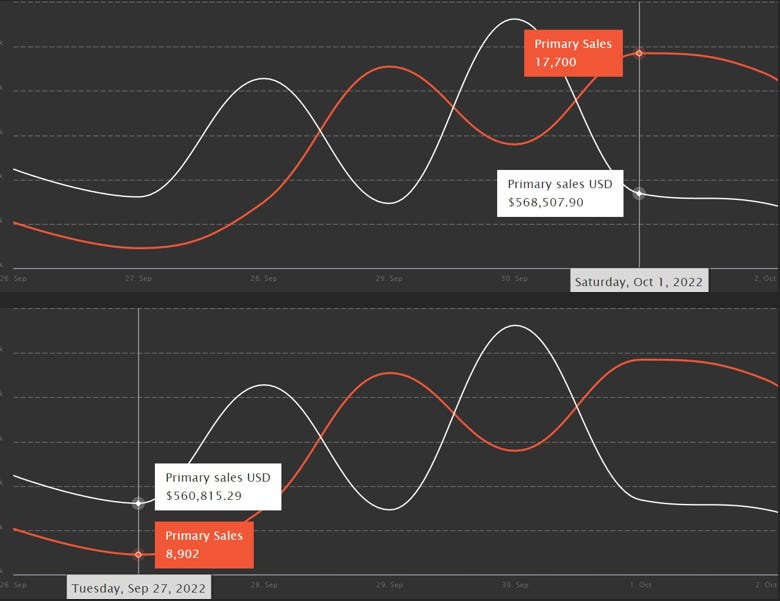
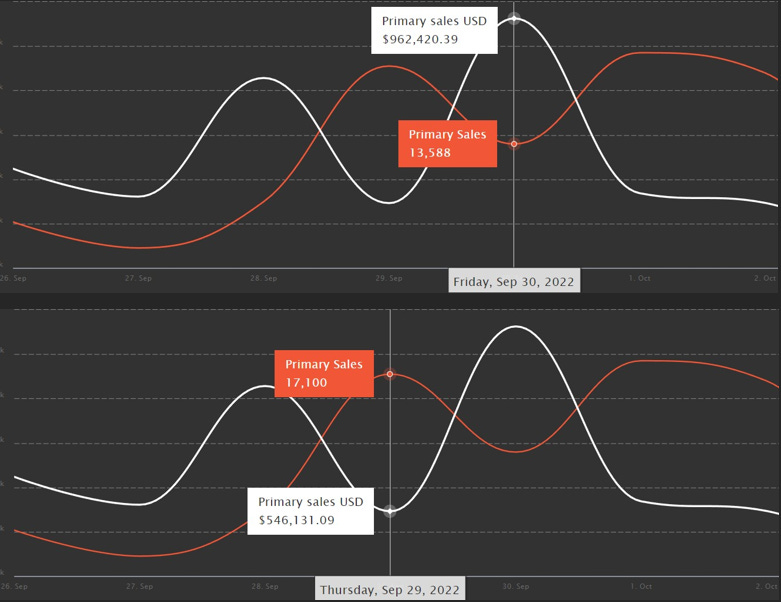
Primary Sales and Volume:
The number of primary sales showed an overall increase throughout the week. The highest number of sales was 17.7K which was recorded on the 1st of October. Meanwhile, the lowest number of sales was 8.9K which was recorded on 27th September.
The primary sales volume showed an overall decrease throughout the week. There was a major pump recording the highest data for this metric of the week. The highest primary sales volume was almost 962.4K$ which was recorded on September 30th. Meanwhile, the lowest primary sales volume was 546.1K$ which was recorded on September 29th.
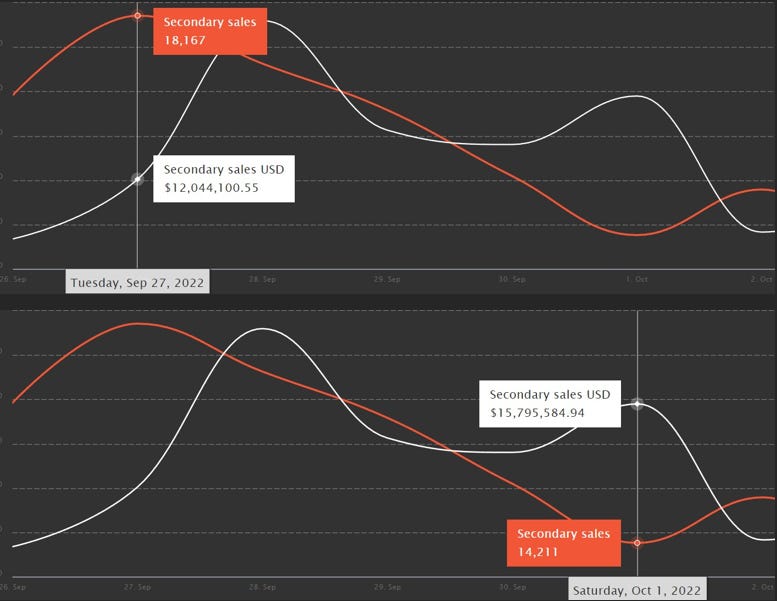
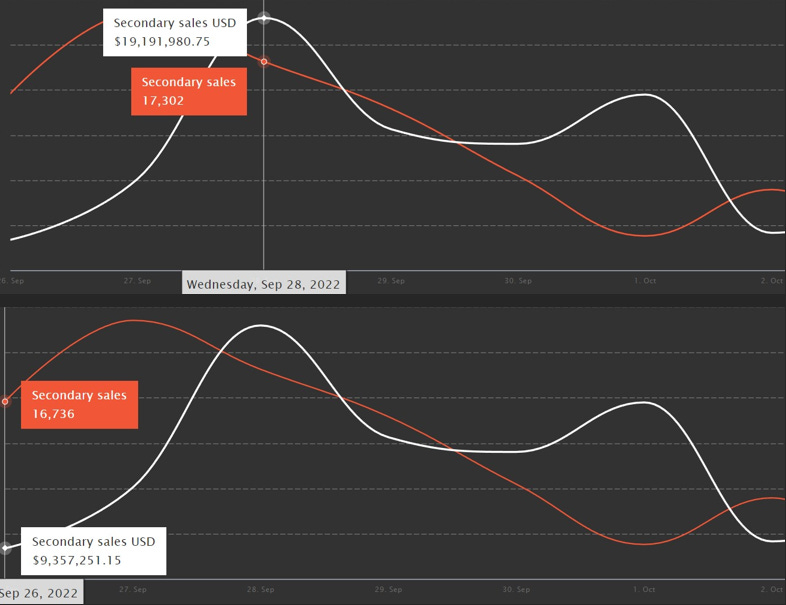
Secondary Sales and Volume:
The number of secondary sales showed an overall decrease throughout the week. The highest number of secondary sales was 18.1K which was recorded on September 27th. Meanwhile, the lowest number of secondary sales was 14.2K which was recorded on October 1st.
The secondary sales volume showed an overall increase throughout the week. The highest secondary sales volume was almost 19.2M$ which was recorded on September 28th. Meanwhile, the lowest secondary sales volume was 9.35M$ which was recorded on September 26th.
Average Price of an NFT:
The highest average price of NFT was recorded on 28th September which was 706$. After it we saw fluctuations and the Lowest of this metric was recorded on 2nd October which was 320$. This metric showed an overall decrease.
Conclusion:
As compared to the previous week’s data, the data for this week showed a decrease. However, the data for the overall volume and the average price of an NFT showed an increase.
The information above does not constitute investment advice, and the author does not ask you to either buy or sell any of the assets mentioned in the article.